

Global Broker Regulation Inquiry App
About WikiFX
English
简体中文
繁體中文
English
Pусский
日本語
ภาษาไทย
Tiếng Việt
Bahasa Indonesia
Español
हिन्दी
Filippiiniläinen
Français
Deutsch
Português
Türkçe
한국어
العربية
اردو


Reduce Stop Distance with the 50% Retrace Entry for Engulfing

WikiFX
|


Abstract:Learn why chasing an engulfing candle at market price often leads to overly wide stops, and how a 50% retrace pending order can shrink that stop distance significantly, improving risk management.
You spot a large bearish engulfing candlestick on your chart. The urge is to jump into a trade straight away at the current market price, expecting the move to continue. But more often than not, price snaps back to retest a level before continuing, hitting a wide stop loss that wipes out the position. This is where the 50% retrace entry method can change your approach. Instead of chasing the market, you wait for price to pull back to the midpoint of the engulfing candles real body. By placing a pending order at that retrace level, you may be able to shrink your stop loss distance significantly, improving the risk‑to‑reward ratio. This article explains how it works with a step-by-step hypothetical example.
 Contents
What Is an Engulfing Pattern?
An engulfing pattern is a two‑candlestick reversal formation. It consists of a first candle with a small real body, followed by a second candle whose large real body completely engulfs the first candle‘s real body. A bearish engulfing occurs when a large red candle opens above or at the prior candle’s close and closes below the prior candles open. Its body entirely covers the small body of the preceding candle, signalling potential selling pressure. A bullish engulfing sees a large green candle open below or at the prior close and close above the prior open. These patterns indicate a possible shift in momentum and often gain attention after a clear trend, near key support or resistance levels.
Why Market Chasing the Engulfing Candle Is a Trap
When a large engulfing bar forms, many beginners interpret its size as confirmation and enter instantly at the closing price. However, impulsive forex moves are frequently followed by a retracement. Price often pulls back to at least 50% of the large candle‘s real body before resuming the intended direction. Entering at the close means entering at an already extended price, forcing a stop loss to be placed far away – typically beyond the engulfing candle’s high or low – to avoid being prematurely stopped out. The wider the stop, the larger the capital at risk, and the harder it becomes to achieve a favourable reward‑to‑risk ratio. This pitfall highlights a core principle: the distance from entry to stop loss directly determines potential loss. If you can enter closer to the hypothetical ‘failure point’ of the pattern, you shrink that distance. The 50% retrace method is designed exactly for that.
How to Calculate the 50% Retrace Entry
Before we dive in, a quick note on pips: in most currency pairs, a pip (percentage in point) is the smallest standard price move, usually the fourth decimal place (0.0001). For example, a move from 1.1410 to 1.1411 is one pip. The method requires only basic arithmetic.
- Identify the engulfing candle and wait for it to close; never act during the candle‘s formation.
- Measure the real body: for a bearish engulfing, subtract the close from the open; for a bullish engulfing, subtract the open from the close. The result is the body size in pips.
- Calculate the 50% retrace level: take the midpoint of the real body. For a bearish engulfing, add half the body size to the close. For a bullish, subtract half the body size from the close.
- A pending order can be placed at that level. For a bearish engulfing, a sell limit order at the midpoint; for a bullish, a buy limit order.
- A stop loss might be placed just beyond the engulfing candle’s extreme. For a bearish setup, above the high; for a bullish, below the low. Allow a small buffer of a few pips.
Hypothetical Example (EUR/USD)
Assume EUR/USD forms a bearish engulfing after a short‑term uptrend:
- Prior small bullish candle: open 1.1400, close 1.1410.
- Engulfing bearish candle: open 1.1410, close 1.1370, high 1.1415, low 1.1365.
The bearish body size = 1.1410 – 1.1370 = 40 pips.
50% retrace level = 1.1370 + 20 pips = 1.1390.
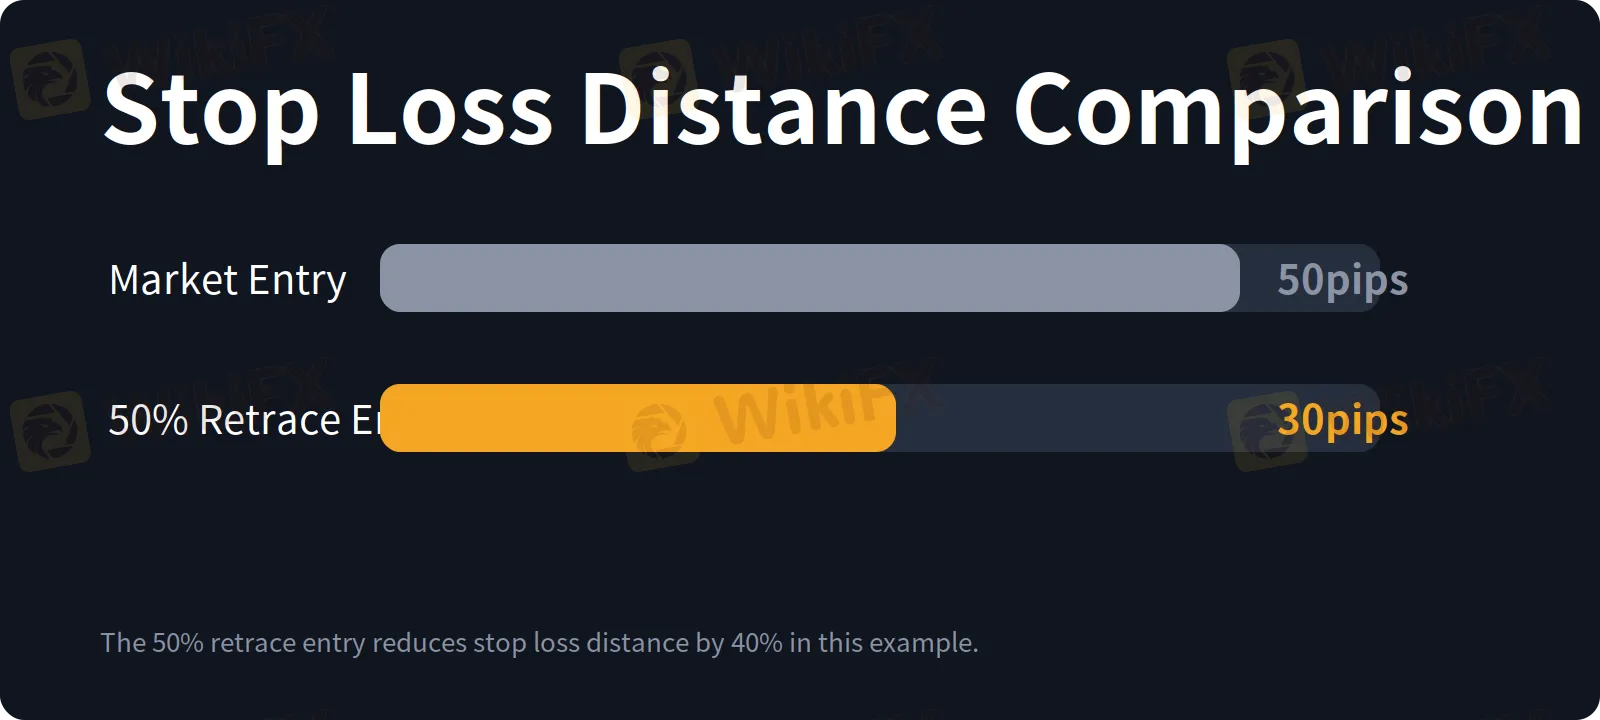
Market chase entry: sell at the close of 1.1370, stop above the engulfing high plus a buffer, say at 1.1420. Stop distance = 50 pips.
50% retrace entry: pending sell limit order at 1.1390, same stop at 1.1420. Stop distance = 30 pips.
That is a reduction of 20 pips, or 40% less than the market entry stop. If a trader were risking RM100 per pip in this purely illustrative scenario, the potential loss would drop from RM5,000 to RM3,000.
Limitations and Common Pitfalls
While the 50% retrace method can improve entry efficiency, it is not a guarantee.
- Missed moves: Price may not retrace to the 50% level and simply continue in the engulfing direction. You will miss the trade – the trade‑off for reduced risk.
- Fake‑outs: Price could hit your pending order and then reverse immediately, stopping you out. A tighter stop may lead to more whipsaws. Combining the method with other confluences, such as a nearby support or resistance area, may help filter some entries.
- Pattern validity: The engulfing pattern tends to carry more weight when it appears at significant technical areas, after a clear trend, and with a real body noticeably larger than preceding candles. Small, choppy candles in a range are less meaningful.
- Risk management still matters: Even with a tighter stop, many traders follow a rule of risking only a small fraction of their account per trade, such as 1–2%. Adjusting position size can help keep monetary risk consistent with a personal plan.
What the 50% Retrace Entry Is – and What It Isnt
The 50% retrace entry method is a tactical tool for optimising entries around engulfing patterns. It is not a standalone trading strategy, nor does it predict the direction or odds of a successful trade. Its sole purpose is to reduce the initial stop loss distance, which can improve the reward‑to‑risk ratio and help keep capital risk lower. The decision to trade must still be based on broader analysis of trend, support/resistance, and market context.
Disclaimer:
The views in this article only represent the author's personal views, and do not constitute investment advice on this platform. This platform does not guarantee the accuracy, completeness and timeliness of the information in the article, and will not be liable for any loss caused by the use of or reliance on the information in the article.
WikiFX Broker
Latest News
Order Execution: What Discretionary Latitude Means for Your Trades
WikiFXScammed Twice: Recovery Fraud Takes Advantages of Victims Again
WikiFXOver RM102 Million Crypto Seized in Romance Scam Crackdown
WikiFXWhy Prices Rush Back to Fill Gaps: Liquidity Voids Explained
WikiFX"High Inspirations" Mastermind Disappears as $25 Billion Investment Scheme Collapses
WikiFXOROKU EDGE Review: Malaysia's SCM Has Blacklisted This Broker , Here's What Traders Are Reporting
WikiFXRupee Hits Two-Month Low as Oil Surges Past $95
WikiFXWhy RBI Sold $6.1 Billion in Forex Markets in May
WikiFXCNMV Red-Flags 9 Unauthorised Investment Platforms
WikiFXFXTF Broker: Withdrawal Complaints and Romance Scam Reports , What Traders Should Know
WikiFX