
Global Broker Regulation Inquiry App
About WikiFX
English
简体中文
繁體中文
English
Pусский
日本語
ภาษาไทย
Tiếng Việt
Bahasa Indonesia
Español
हिन्दी
Filippiiniläinen
Français
Deutsch
Português
Türkçe
한국어
العربية
FPG USOUSD Market Report May 7, 2026
Abstract:On the M30 timeframe chart, USOUSD appears to have dropped back below the 100 level after experiencing a major bearish breakdown over the past sessions. A significant price decline occurred as the mar
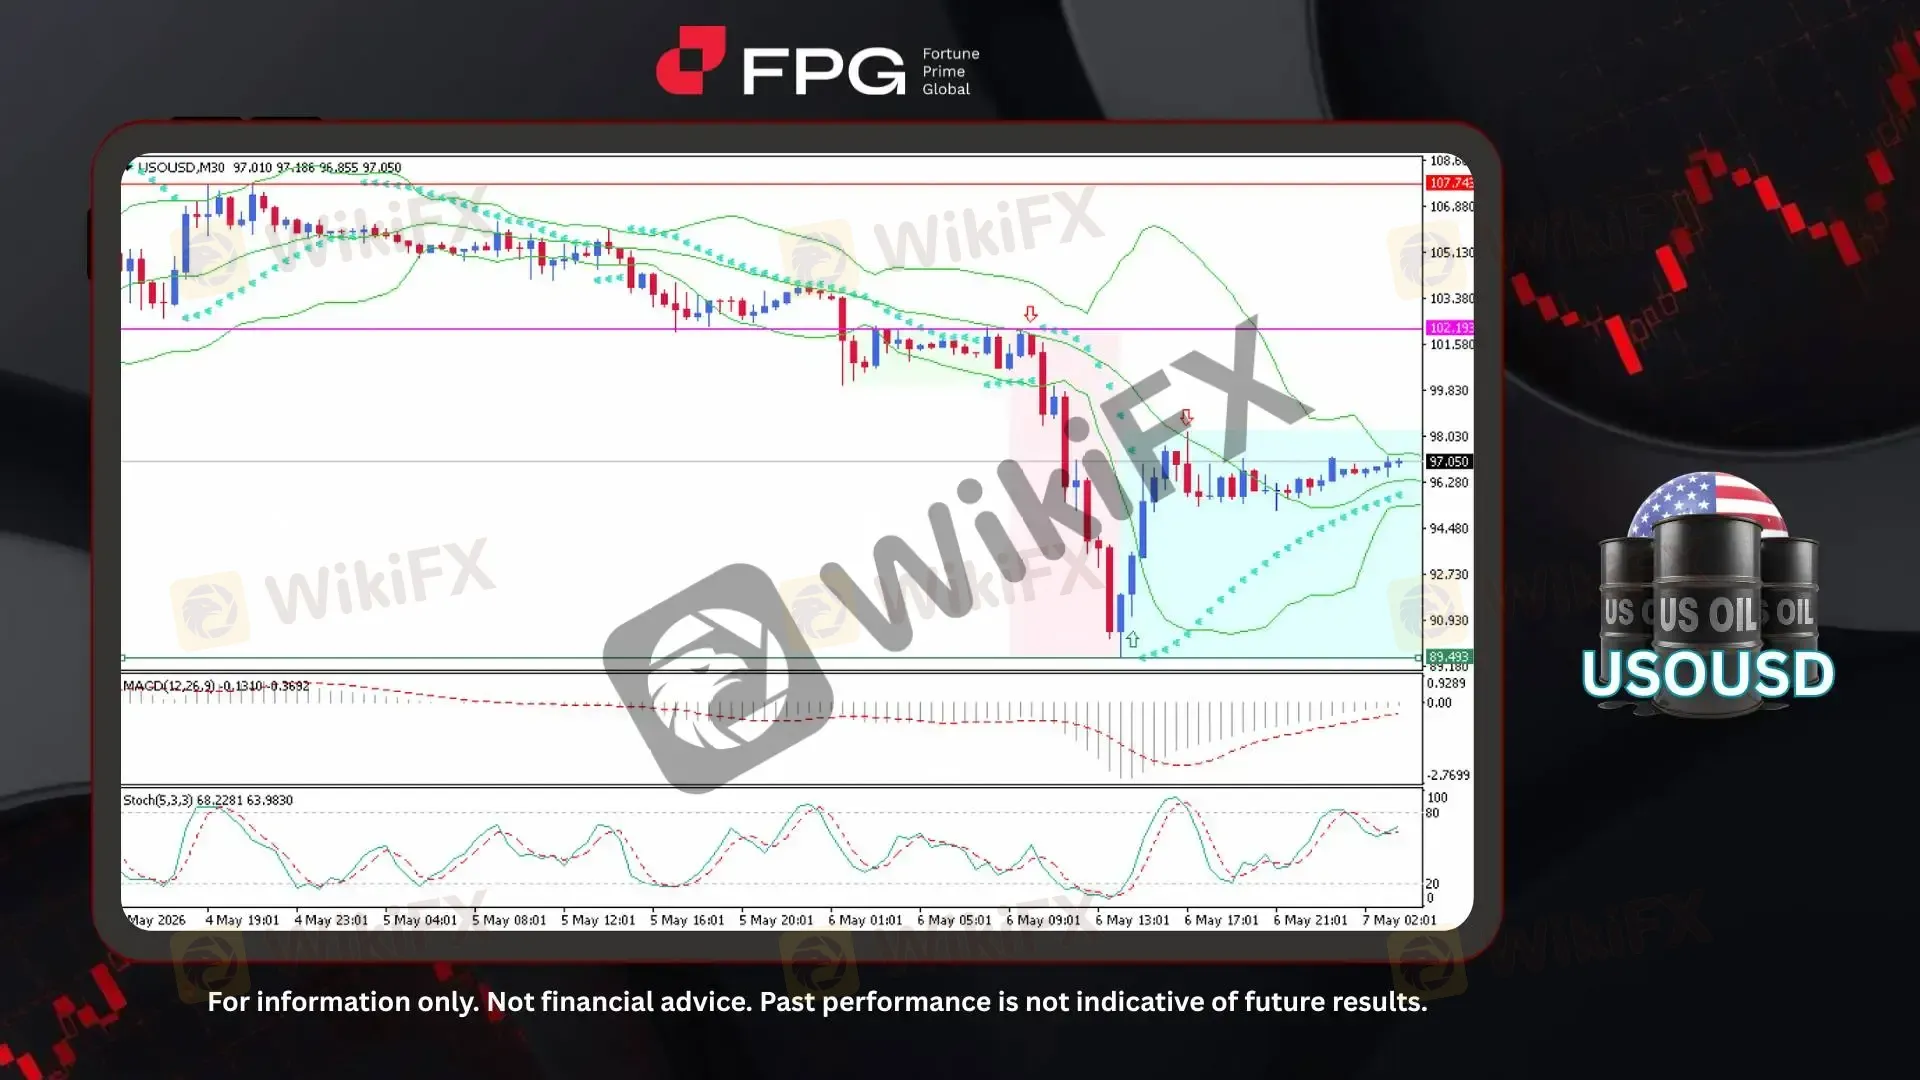
On the M30 timeframe chart, USOUSD appears to have dropped back below the 100 level after experiencing a major bearish breakdown over the past sessions. A significant price decline occurred as the market fell sharply from 102.19 down to 89.49, reflecting extremely strong selling pressure and heightened market panic. Following that aggressive decline, a corrective rebound emerged, lifting the current price back toward 97.05. However, despite this recovery, price action remains below the previous breakdown zone, indicating that the broader structure is still under bearish pressure. Recent candles have become relatively smaller and more stable, suggesting that the market is entering a temporary consolidation phase after the sharp volatility spike.
From a technical perspective, Bollinger Bands have started to narrow significantly following the earlier expansion, reflecting declining volatility and the transition into a consolidation environment. Price is currently moving around the middle band, indicating a more balanced short-term market condition after the aggressive selloff. The MACD (12,26,9) remains in negative territory around -0.1310 / -0.3692, confirming that bearish momentum still dominates overall, although the histogram has started to recover gradually, signaling that downside pressure is weakening. Meanwhile, the Stochastic Oscillator (5,3,3) is trading around 68.22 / 63.98, positioned in the upper-middle range, suggesting that the corrective rebound still has momentum, although it is approaching levels where bullish momentum could begin to slow.
Recent economic policies affecting oil prices include OPEC+ production adjustments, geopolitical tensions in the Middle East, and central banks maintaining high interest rates amid inflation concerns. Markets are also pressured by weakening global demand, slower economic growth in China, and uncertainty surrounding future U.S. trade and energy policies. At the same time, expectations of oversupply increased following signals of potential output hikes from several oil-producing countries. Combined with softer demand momentum, these factors recently pushed crude oil prices sharply lower, falling back below the 100 level.
Technical Market Overview
1. Current Position: USOUSD is currently trading around 97.05 after staging a corrective rebound from the recent low at 89.49. Price action shows a temporary recovery phase following an aggressive bearish collapse, but the overall structure still reflects a broader bearish environment as price remains below the major breakdown zone around 102.19.
2. Resistance Zone: Immediate resistance is located at 98.03, aligning with the recent consolidation ceiling and short-term recovery barrier. A stronger resistance zone is seen around 102.19, representing the previous breakdown level and a major supply zone where the strong bearish move originally accelerated.
3. Support Zone: Nearest support is identified at 96.28, which currently acts as short-term intraday support during the consolidation phase. A deeper and more critical support zone lies around 89.49, marking the recent extreme low and the bottom of the sharp bearish expansion.
4. Indicator Observation: Technical indicators continue to reflect a broader bearish outlook despite the ongoing corrective rebound. Bollinger Bands are narrowing, indicating reduced volatility and consolidation after the prior impulsive move. The MACD (12,26,9) remains below the zero line, confirming bearish dominance, although the improving histogram suggests selling pressure is gradually fading. Meanwhile, the Stochastic Oscillator (5,3,3) is moving in the upper-middle range, signaling that short-term bullish correction momentum remains active but may begin slowing near resistance.
5. Technical Summary: Overall, USOUSD maintains a bearish bias following the strong breakdown below the 100 level, although a corrective rebound is currently developing. The current consolidation suggests the market is attempting to stabilize after the aggressive selloff, but upside momentum remains limited unless price can reclaim higher resistance levels. A rejection below 98.03 could reinforce bearish continuation toward lower support zones, while a stronger breakout above resistance may open room for a deeper recovery toward the 100–102 region.
Market Performance:
Commodities Last Price % Change
UKOUSD 106.43 +0.08%
Today's Key Economic Calendar:
US: Fed Goolsbee & Hammack Speeches
JP: BoJ Monetary Policy Meeting Minutes
AU: Balance of Trade
DE: Factory Orders MoM
EU: ECB de Guindos Speech
UK: S&P Global Construction PMI
EU: Retail Sales MoM
EU: ECB Elderson Speech
US: Initial Jobless Claims
US: Nonfarm Productivity QoQ Preliminary
EU: ECB Lane Speech
Risk Disclaimer: This report is for informational purposes only and does not constitute financial advice. Investments involve risks, and past performance does not guarantee future results. Consult your financial advisor for personalized investment strategies.
Disclaimer:
The views in this article only represent the author's personal views, and do not constitute investment advice on this platform. This platform does not guarantee the accuracy, completeness and timeliness of the information in the article, and will not be liable for any loss caused by the use of or reliance on the information in the article.
WikiFX Broker
Latest News
INTERTRADER Review 2026: Should You Trade With This Broker?
 WikiFX
MSquare Review 2026: Is this Forex Broker Legit or a Scam?
WikiFXHYCM UK Swings to £236,304 Loss in 2025 as Costs Outpace Revenue Growth
WikiFXDollar Retreats As Ceasefire Holds
WikiFXjustchill Review 2026: Unregulated Status, Low Score, and High-Risk Signals
WikiFXRM1.05 Billion Lost to Online Scams | Malaysia Races Against Time to Recover Funds
WikiFXIndia’s 10-Year G-Sec Yield Rises 7.1%; Check How It Impacts Your Life
WikiFXSurging gas prices are hurting lower income households harder, New York Fed study shows
WikiFXGLOBAL PRIME Review 2026: Is this Forex Broker Legit or a Scam?
WikiFXWhy That FCA Regulation Logo Might Not Protect You
WikiFXCurrency Calculator
USD

CNY
Current Rate:0
Enter amount
USD
Redeemable Amount
CNY
Calculate 