


FCA Warns reclaim-experts.com: 7 Checks Before You Pay
The UK regulator classified the website as a clone of an authorised firm on 28 August 2026. The FCA says the genuine Reclaim Experts Ltd has no connection with the clone.
Original

简体中文
繁體中文
English
Pусский
日本語
ภาษาไทย
Tiếng Việt
Bahasa Indonesia
Español
हिन्दी
Filippiiniläinen
Français
Deutsch
Português
Türkçe
한국어
العربية
اردو




Abstract:Candle patterns are an important way to identify the current forex market. You'll notice many variations in candle patterns.

What is Tweezer Candlestick Formation?
Pattern analysis is a very important technical analysis method in FX trading market, and reversal pattern analysis among them has made many investors puzzled. Since the everlasting changeable forex situation, the market trend often reverses, which usually makes some investors unprepared to react, causing large or small losses to them. Tweezer candlestick pattern is one of the reversal patterns. It is used as a reliable indicator of reverse trading.
The tweezer pattern commonly involves two candlesticks in opposite colors. Their bodies are almost the same length and even longer as the other candlesticks. This pattern usually occurs at the end of a trend (low or high). It is seen as a sign of a market reversal. You can use it to make profitable trades.
Different Types of Tweezer Candlesticks
Tweezer top and bottom, also known as tweezers, are reversal candlestick patterns that signal a potential change in the price direction. Both formations consist of two candles that occur at the end of a trend, which is in its dying stages.
The Tweezer Top formation is viewed as a bearish reversal pattern is seen at the top of uptrends and the Tweezer Bottom formation is viewed as a bullish reversal pattern seen at the bottom of downtrends. Essentially, with both formations, either buyers or sellers were not able to push the top or bottom any further. Both types of patterns require close observation and research to be interpreted and used correctly.
▶Tweezer Top Formation
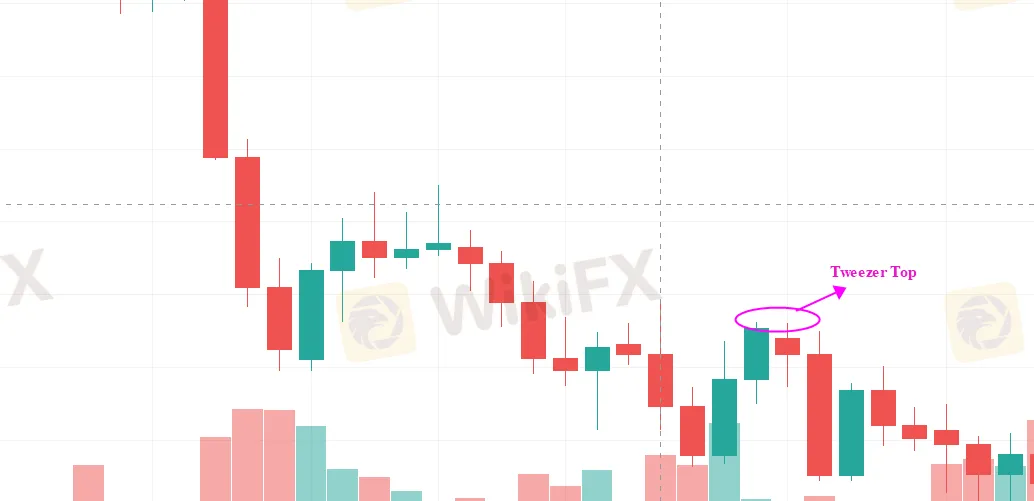
Tweezer Top pattern is a bearish reversal candlestick pattern that is formed at the end of an uptrend. It consists of two candlesticks -- Bullish Candle + Bearish Candle. The first one being bullish and the second one being bearish candlestick.
Both the tweezer candlestick make almost or the same high.
▶Tweezer Bottom Formation
Tweezer Bottom candlestick pattern is a bullish reversal candlestick pattern that is formed at the end of the downtrend.
It consists of two candlesticks -- Bearish Candle + Bullish Candle. Tthe first one being bearish and the second one being bullish candlestick.
Both the candlesticks make almost or the same low.

How to Interpret Tweezer Patterns?
As reversal patterns, tweezers are quite popular with traders searching for clues for when the market will change direction. Reversals offer a great risk/reward ratio as we may be presented with an opportunity.
For this reason, tweezers are a popular tool of gauging the market sentiment and interpreting information from the candlesticks. While the trend may continue in the same direction even though tweezers are in place, which of course is more than normal, given that no pattern is perfect, the appearance of the second candle signals that the opposite force is growing in the game, which had been dominated by one side.
Tweezer bottoms are considered to be short-term bullish reversal patterns, whereas tweezer tops are thought to be bearish reversals. Essentially, with both formations, either buyers or sellers were not able to push the top or bottom any further. Both types of patterns require close observation and research to be interpreted and used correctly.
A bearish tweezer top occurs during an uptrend when bulls push prices higher, often ending the day near the highs (generally considered a strong bullish signal). Then, on the following (second) day, traders reverse their market sentiment. The market opens, does not breach the prior day's highs, and heads straight down, often eliminating most of the prior period's gains.
▶Trade the Tweezer Top Pattern
The tweezer top candlestick formation occurs at the top of an uptrend, therefore it is a bearish pattern. In the example below, we have a EUR/USD daily chart and the initial trend is bullish.

As you can see, it is an extremely powerful bullish trend. At the top, the price action gaps higher and continues in the same direction. Albeit the strong powerful trend, the next candle is extremely bearish as its body is almost double the body of the prior candle.
Hence, not only were the prior candles gains erased, but the gap was filled in as well. This type of a bearish tweezer is extremely strong due to the shape of the second candle, and the chances of a reversal are very high.
Our entry is where the second candle closed the day.
Thus, we use different types of analysis to see where the reversal may end. Given the strength of the bull run, it is likely that the reversal will be powerful as well. Finally, we take the start of the bull trend as a reference for take profit.
▶Trade the Tweezer Bottom Pattern
On the flip side, a bullish tweezer bottom is realized during a downtrend when bears continue to drive prices lower, closing the day near lows (usually a strong bearish trend). Again, Day 2 is a reversal, as prices open, do not breach the prior day's lows, and head sharply higher. A bullish advance on Day 2 can quickly eliminate losses from the previous trading day.

As talked earlier, the bullish tweezer occurs at the bottom of a downtrend. The EUR/USD price action on the daily chart had been moving lower for a longer period of time, as a series of the lower highs and lower lows was recorded.
If you look at the bullish tweezer at the bottom, the first candle is a strong powerful bearish candle that signals the continuation of the downside move. However, the second candle prints a new short-term low before surging higher to erase almost all losses that occurred in the prior session.
Going forward, the bulls are able to build on the gains made during the second candles timeframe and ultimately push the price action higher, completely reversing the trend.
Our entry is where the second candle closed the day.
In this case, we see a very strong bullish candle that further adds to the overall bullishness of the tweezer bottom candlestick pattern. This is, among other things, the reason the reversal was extremely powerful.
What are the Pros and Cons Using Tweezer Top and Bottom Patterns?
Pros
Lets look at the pros of the tweezer top and bottom patterns:
· Tweezer patterns are reliable price reversal patterns that place traders at the top of a new trend.
· The tweezer pattern can reliably explain buyer and seller sentiment.
· Tweezer patterns from a necessary support and resistance level increase the trading accuracy of other indicators and methods.
· This trading strategy integrates well with other indicators.
Cons
There are also some downsides to using the tweezer top and bottom patterns:
· It can be tricky to rely on trend reversal just by looking at two candles. The addition of increased volatility indicates a highly probable price reversal.
· If the tweezer pattern forms against a major trend, it may not work as well.
· Tweezer patterns occur regardless of market volatility and uncertainty.
· Investors should use other indicators besides the tweezer pattern to increase its accuracy.
Combine With Other Signals
In financial trading, investors are advised to use multiple methods to increase the probability of a trading entry. Using tweezer patterns are a reliable way to catch a trend from its beginning.
When a tweezer top appears at a swing high, it indicates that bulls are getting out of the market—and bears may be taking over. The reverse is true for a tweezer bottom at a swing low. Therefore, investors should manage their trades by closing a profit and moving the stop-loss to break-even. Overall, the tweezer trading method is profitable -- provided that traders can match this pattern with other signals for additional confirmation like support, resistance, market context, volume or trend.

Disclaimer:
The views in this article only represent the author's personal views, and do not constitute investment advice on this platform. This platform does not guarantee the accuracy, completeness and timeliness of the information in the article, and will not be liable for any loss caused by the use of or reliance on the information in the article.

The UK regulator classified the website as a clone of an authorised firm on 28 August 2026. The FCA says the genuine Reclaim Experts Ltd has no connection with the clone.

People searching GODO regulation or regulation GODO should separate overseas licensing from permission in India. The Reserve Bank of India Alert List, updated 19 November 2025, names “GoDo FX” and godofx.com. RBI says listed entities are neither authorised to deal in forex under FEMA nor authorised to operate an approved forex electronic trading platform. GODO's legal documents name GODO LTD and a Mauritius FSC licence, but that overseas status does not create RBI authorisation. No cited court ruling proves fraud. The main checks are jurisdiction, domains, leverage, and withdrawals.

Most traders who have opened accounts with Succedo Markets, a Saint Lucia-based brokerage entity, have reported withdrawal request denials after a pleasant first experience. Traders globally, including those from India, have made these complaints. Meanwhile, some traders have reportedly taken legal recourse to recover their stuck funds. The critical nature of these complaints made us share this in-depth Succedo Markets review. This review does not only examine user allegations but also shed light on its regulatory framework.

Did you encounter trade-related concerns with Tattvam, a Mauritius-based brokerage entity? Several users have reportedly accused the broker of cancelling profitable trades, allegedly citing scalping as the reason. At the same time, traders have reportedly expressed concerns over the lack of understanding among the broker officials about critical trading aspects such as copy trading. In this Tattvam review, we have carefully examined user-reported allegations. Additionally, we have given a regulatory overview of the broker.
WikiFXWikiFXWikiFXWikiFXWikiFXWikiFXWikiFXWikiFXWikiFXWikiFX