Abstract:Probably one of the more compelling areas of price action is in its ability to show key levels or price zones that matter. And to be sure, there’s a lot of ways of finding potential support and resistance levels but none of those prices are worth very much if they don’t actually show as support or resistance.

For the purpose of identifying support and resistance, candlestick wicks can be incredibly powerful and this also speaks to multiple time frame analysis.
If youre following prices on an hourly chart and price suddenly reverses from a bullish trend, erasing the entirety of the move – how would that show on a daily chart?
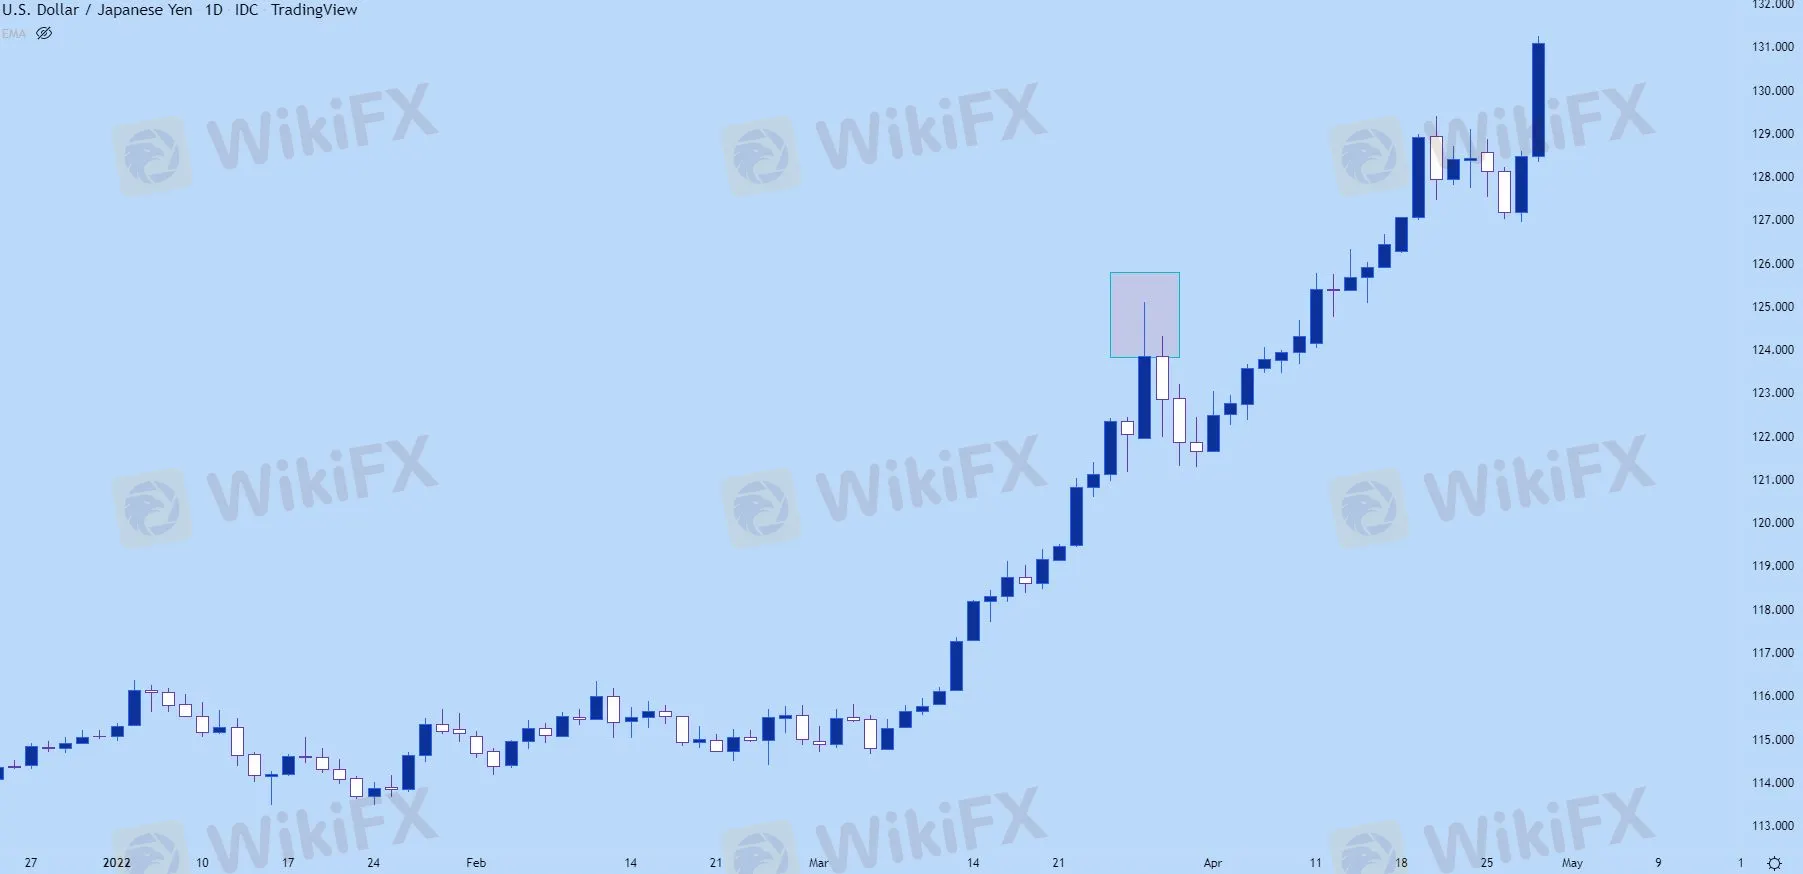
Likely, this will illustrate as a wick sitting atop that daily bar indicating the reversal that had taken place. On the below daily chart of USD/JPY, Ive identified such an extended wick, and notice that the three days that followed continued to see prices pull back despite a very strong trend that led into the move.
USD/JPY Daily Price Chart
On the below hourly chart, were taking a closer look at that same iteration and we can see that there was an extended upper wick there, as well, albeit much smaller than the wick that showed on the daily.
That three day sell-off started from a fairly clear reversal that had even showed on the hourly chart.
What‘s going on here: Likely there was a catalyst of some type that started a fast reversal and this is simply the playing out of that new ’bearish‘ factor getting priced-in. And, as we looked price action trends, trends do not move in a linear manner, its often a sequencing of ’two steps forward, one step back,‘ and that’s showing in the below example after the reversal began as ‘two steps down, one step up.’
USD/JPY Hourly Price Chart
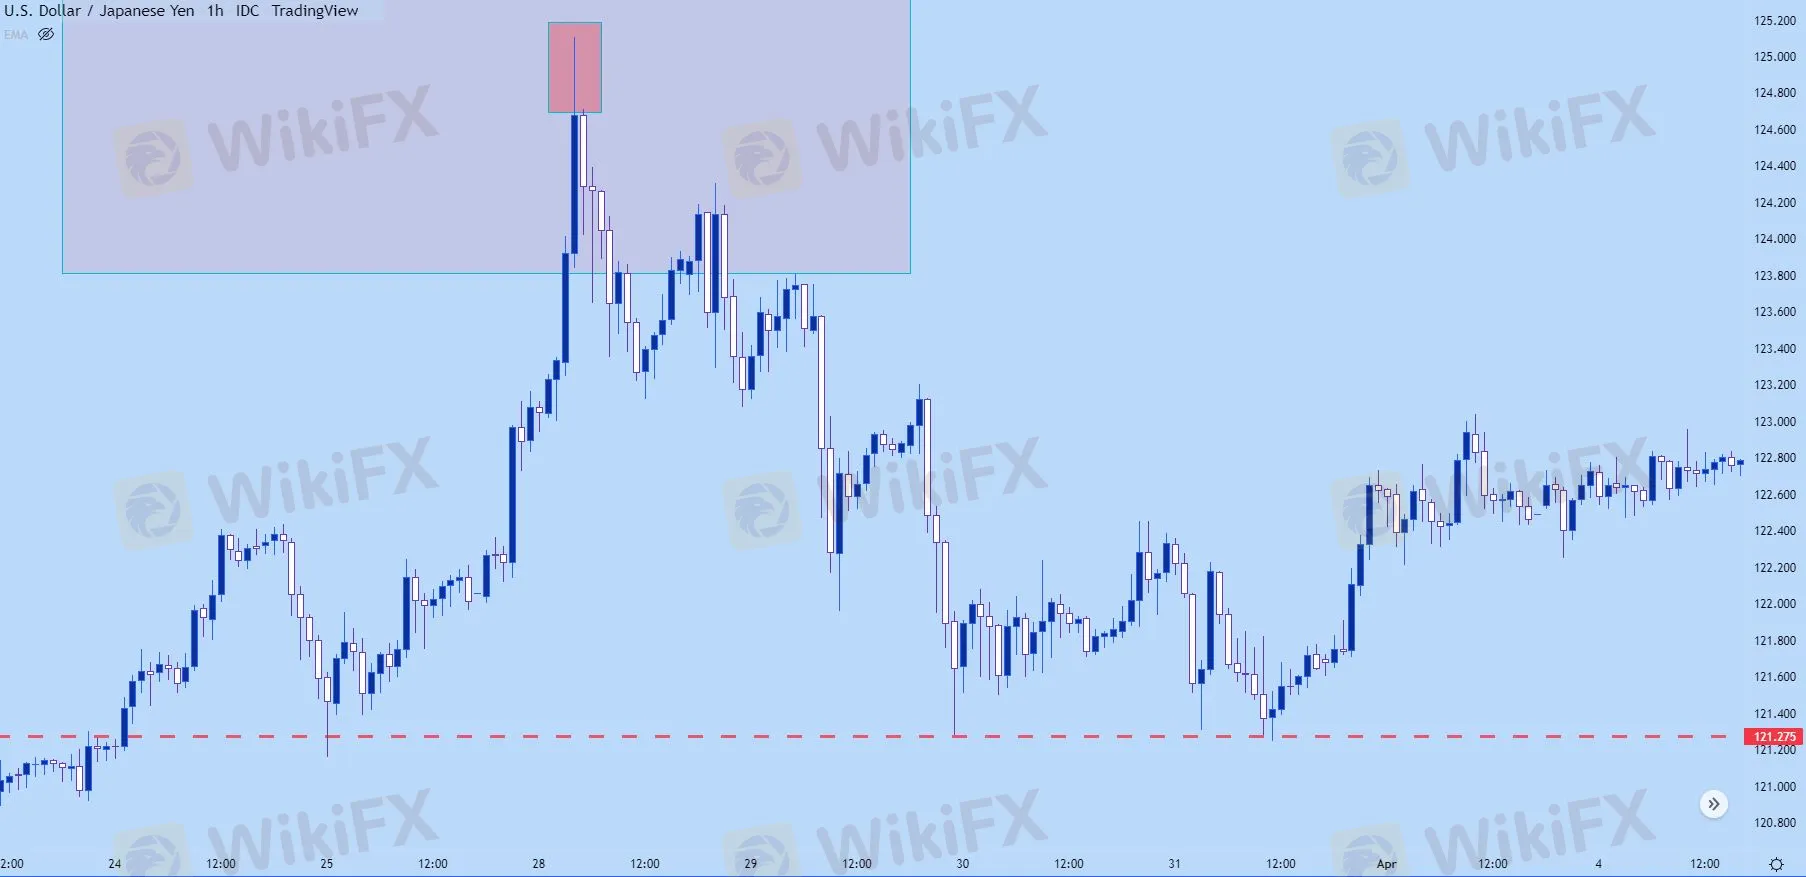
You might notice on the above chart, the red line along the bottom. Well that‘s pretty key for support and resistance identification when using price action, and we’ll dig into that in our next article on the topic.